

TL;DR:
- Net Promoter Score (NPS) measures customer loyalty by asking how likely customers are to recommend a business, resulting in a score between -100 and +100. Proper calculation involves including Passives in the total responses and subtracting the percentage of Detractors from Promoters; interpreting scores requires industry-specific benchmarks and trend tracking. The true value of NPS depends on organizational follow-up and segment-level analysis, making it a powerful tool for improving loyalty and growth when integrated into operational routines.
Net Promoter Score (NPS) is a single-question customer loyalty metric that measures how likely your customers are to recommend your business to others, producing a score between -100 and +100. Developed by Fred Reichheld and introduced in a 2003 Harvard Business Review article, NPS has become the most widely adopted loyalty benchmark across Fortune 500 companies and small businesses alike. Apple, Amazon, and Tesla regularly cite NPS as a core performance indicator. This article gives you a complete NPS score explained breakdown, from the formula and classification system to industry benchmarks and the practical steps that turn a number into real business growth.
How to calculate your NPS score step by step
Understanding NPS starts with the survey itself. Every respondent answers one question on a 0 to 10 scale: “How likely are you to recommend us to a friend or colleague?” Based on their answer, respondents fall into three categories: Promoters (scores 9 to 10), Passives (scores 7 to 8), and Detractors (scores 0 to 6). Promoters are loyal advocates who drive referrals. Detractors are dissatisfied customers who can damage your reputation. Passives sit in the middle, neither enthusiastic nor hostile.

The NPS formula
The NPS formula is straightforward: subtract the percentage of Detractors from the percentage of Promoters. Passives are counted in the total number of respondents (the denominator) but are not included in the subtraction itself. This is the step most business owners get wrong.
Here is a worked example with 100 survey responses:
| Respondent group | Count | Percentage |
|---|---|---|
| Promoters (9–10) | 60 | 60% |
| Passives (7–8) | 20 | 20% |
| Detractors (0–6) | 20 | 20% |
| NPS result | +40 |
Calculation: 60% Promoters minus 20% Detractors = NPS of +40.
The four steps to calculate NPS correctly are:
- Collect all survey responses on the 0 to 10 scale.
- Count and categorize respondents into Promoters, Passives, and Detractors.
- Divide each group by the total number of respondents (including Passives) to get percentages.
- Subtract the Detractor percentage from the Promoter percentage.
Pro Tip: Use survey platforms like SurveyMonkey, Delighted, or Qualtrics to automate NPS calculation. These tools eliminate manual math errors and generate trend reports automatically, saving hours of spreadsheet work each month.
What does your NPS score mean? Benchmarks and interpretation
NPS scores range from -100 to +100. Any positive score means you have more Promoters than Detractors, which is a healthy baseline. A score above +50 is generally considered excellent, and scores above +70 place a company among the top performers in most industries. A negative score signals that dissatisfied customers outnumber your advocates, which correlates directly with churn risk.
The critical nuance in NPS score interpretation is that no single universal benchmark applies across all industries. Industry context determines whether a given score is strong or weak. A +20 NPS in the cable and telecom sector is competitive because that industry consistently scores low. A +20 in e-commerce or SaaS, where customer expectations are higher and switching costs are lower, may indicate a serious loyalty problem.
NPS benchmarks by industry
The table below shows approximate NPS ranges that reflect competitive performance in each sector. These are directional guides, not fixed standards.
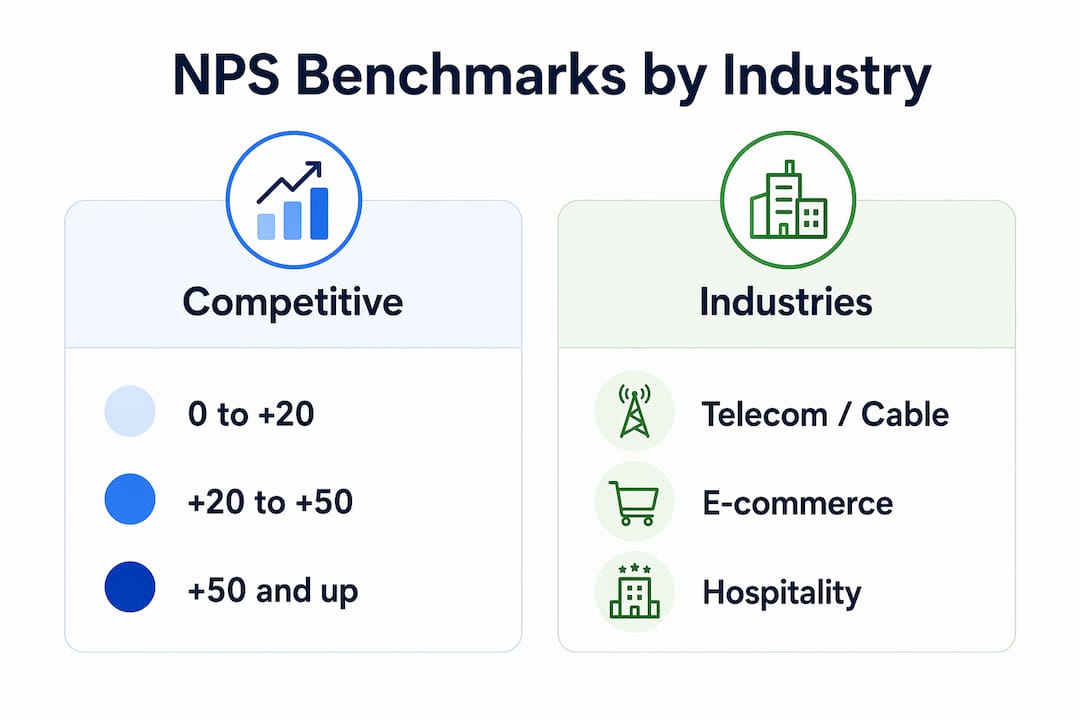
| Industry | Below average | Competitive | Strong |
|---|---|---|---|
| Telecom / Cable | Below 0 | 0 to +20 | Above +20 |
| E-commerce / Retail | Below +30 | +30 to +50 | Above +50 |
| SaaS / Technology | Below +20 | +20 to +45 | Above +45 |
| Financial services | Below +15 | +15 to +35 | Above +35 |
| Healthcare | Below +20 | +20 to +40 | Above +40 |
Tracking your score over time matters more than hitting a specific number. A company that moves from +15 to +35 over 18 months is demonstrating real loyalty improvement, even if +35 is only average for its sector. NPS functions best as a loyalty indicator across the full customer relationship lifecycle, not as a one-time snapshot.
Pro Tip: Before comparing your score to published industry averages, confirm that those benchmarks use the same 0 to 10 scale and the same Promoter/Detractor breakpoints. Inconsistent methodology makes cross-company comparisons meaningless.
Common pitfalls and misunderstandings in NPS calculation
The most frequent calculation error is excluding Passives from the denominator. If you survey 100 people and only divide by the number of Promoters and Detractors (say, 80), your percentages inflate artificially. The correct method always divides by total respondents, including every Passive. This mistake can make a mediocre score look significantly better than it is.
Beyond the math, the bigger strategic risk is what researchers call the Aggregate Illusion. Collapsing all NPS data into one number hides which customer segments, touchpoints, or journey stages are driving your score up or down. A company with an overall NPS of +35 might have a +60 among long-term enterprise clients and a -10 among new customers in their first 90 days. The aggregate looks fine. The onboarding problem is invisible.
Other common pitfalls include:
- Changing the question wording or scale between surveys. Consistent methodology is the only way to make trend comparisons valid. Even small wording changes shift how respondents interpret the question.
- Ignoring Passives entirely. A large passive respondent share can keep your NPS stable while actual loyalty growth stagnates. Passives represent customers who are not yet loyal advocates, and they are your most accessible conversion opportunity.
- Treating NPS as a diagnostic tool on its own. NPS tells you that a problem exists. It does not tell you where or why without follow-up questions and segment-level analysis.
“NPS without segmentation is like a dashboard with only a fuel gauge. It tells you something important, but not enough to drive well.” This is why connecting scores to specific customer journeys is the difference between a metric and a management tool.
How to use NPS results to improve loyalty and growth
The score itself is not the goal. The goal is the organizational behavior the score triggers. Connecting NPS to customer segments and touchpoints is what converts a number into decisions that reduce churn and increase referrals. Here is a practical framework for doing that:
- Segment your scores immediately. Break NPS data down by customer type (new vs. long-term), product line, geographic region, and key touchpoints such as onboarding, support interactions, and renewal. This reveals where loyalty is being built and where it is being lost.
- Build a closed-loop feedback system. Survey consistently on a schedule and assign follow-up owners for every Detractor response within 48 hours. A personal outreach to a Detractor converts a complaint into a retention opportunity more often than most managers expect.
- Target Passives with specific conversion programs. Passives are often overlooked but represent customers with moderate loyalty who can be converted to Promoters with targeted efforts. A well-timed loyalty incentive, a product education email, or a proactive check-in call can shift a 7 to a 9. Explore customer loyalty program strategies for specific conversion tactics that work across industries.
- Integrate NPS into your customer satisfaction measurement stack. NPS works best alongside Customer Effort Score (CES) and Customer Satisfaction Score (CSAT). Each metric captures a different dimension of the customer experience. You can learn more about satisfaction survey design to build a measurement system that gives you the full picture.
- Connect operational changes to score movements. When you redesign an onboarding flow, reduce support response times, or launch a new feature, track whether NPS in the affected segment moves within the next survey cycle. This creates accountability and proves the ROI of customer experience investments.
Pro Tip: Use lifecycle email sequences triggered by NPS responses to automate follow-up at scale. Platforms like PartnerLlama’s lifecycle marketing tools let you route Detectors into recovery sequences and Promoters into referral programs without manual intervention.
The Net Promoter System developed by Bain and Company treats NPS not as a reporting metric but as an operating discipline. Companies that use it this way, with regular cadences, cross-functional ownership, and closed-loop accountability, consistently outperform those that treat it as a quarterly dashboard number.
Key takeaways
NPS is only as valuable as the organizational system built around it: the score measures loyalty, but the follow-up actions determine whether that loyalty improves.
| Point | Details |
|---|---|
| NPS formula | Subtract % Detractors from % Promoters; always include Passives in the total denominator. |
| Score interpretation | Compare against industry-specific benchmarks, not a universal standard, and track trends over time. |
| Passives are an asset | Customers scoring 7 to 8 are your fastest path to more Promoters with targeted follow-up. |
| Avoid the Aggregate Illusion | Segment NPS by customer type and touchpoint to find where loyalty is actually breaking down. |
| Close the loop | Assign follow-up owners for Detractor responses within 48 hours to convert complaints into retention wins. |
Why NPS is only as good as what you do with it
I have worked with business owners across retail, SaaS, and professional services who treat NPS as a reporting metric. They survey customers, post the number in a board deck, and move on. The score rarely improves, and when it does, nobody can explain why.
The companies that actually move their NPS are the ones that treat it as an operating rhythm. They review segment-level data weekly, not quarterly. They have a named person responsible for every Detractor follow-up. They connect NPS shifts to specific operational changes so they know what is working.
What I have found consistently is that the Passive group is where the real opportunity hides. Most managers focus on Detractors because they feel urgent. But converting 20% of your Passives to Promoters has a larger mathematical impact on your score than recovering half your Detractors. That insight alone changes how you prioritize your customer success resources.
My honest recommendation: do not add NPS to your metrics stack until you have a clear answer to the question “Who owns the follow-up?” Without that answer, you are collecting data that creates no change. With it, NPS becomes one of the most cost-effective loyalty tools available to a business of any size.
— Maayan
Grow your business with the right digital foundation
Understanding your NPS score is one piece of a larger customer growth strategy. The businesses that convert loyalty data into revenue are the ones with a strong digital presence that makes it easy for Promoters to refer, for Passives to re-engage, and for new customers to find you in the first place.

At Seo-analytic, we help business owners build that foundation. From building your business website to running targeted digital marketing campaigns, our team translates customer loyalty insights into traffic, conversions, and measurable growth. If you are ready to turn your NPS data into a real acquisition and retention engine, explore our digital marketing basics guide built specifically for business owners in 2025 and beyond.
FAQ
What is an NPS score?
NPS (Net Promoter Score) is a customer loyalty metric based on a single 0 to 10 question asking how likely customers are to recommend your business. Scores range from -100 to +100, with higher scores indicating stronger loyalty.
How do you calculate NPS?
Subtract the percentage of Detractors (scores 0 to 6) from the percentage of Promoters (scores 9 to 10), using the total number of respondents including Passives as the denominator. A result of +40 or above is generally considered strong in most industries.
What is a good NPS score?
A good NPS score depends on your industry. A +20 is competitive in telecom but below average in e-commerce. Tracking your own score trend over time is more meaningful than comparing against a single published benchmark.
Why do Passives matter in NPS?
Passives (scores 7 to 8) are counted in the total respondent pool, which affects the accuracy of your Promoter and Detractor percentages. A large Passive group can also mask stagnating loyalty, since these customers have not yet committed to recommending your business.
How often should you survey customers for NPS?
Survey on a consistent schedule, whether monthly, quarterly, or after key touchpoints like onboarding or support interactions. Consistent timing and identical question wording are required for reliable trend analysis and industry benchmarking.
Recommended
- Top Benefits of Digital Marketing for US Business Owners in 2025 – seo analytic
- Top Website Optimization Tips for US Business Owners 2025 – seo analytic
- Digital Advertising Explained for Business Owners in 2025 – seo analytic
- Social Media Marketing Explained: 2025 Guide for Business Owners – seo analytic